Today we looked at tools that could help us manage data, make work more interesting and ways to help our students succeed with their blogs.
First, we connected with Dorothy through Google Hangouts. This was a chance for us to use rewindable learning from the week before. Dorothy spoke about Te Hanga - Create. Create is all about hooking the students into their learning. For me 'create' is at the centre of learning, this is because I want students to engage and be motivated. Create can be where students are able to have fun and explore their understanding of models or ways that suit individual needs.
In my class, create is done in both digital and non-digital ways. I feel as though as long students are able to explore, discover, think, imagine, engage and use ideas they are able to create.
A tool that we looked at today was Google Forms. Google forms have many uses, it can help gather assessment, gather thoughts, share ideas, vote on things, create pathways for reading or writing activities.
For me, I know I will use Google Forms for gathering summative assessment. This will allow me to gather data on the knowledge of my students in areas of learnings.
The process of using forms was very simple and straight forward.
Add questions - when adding your questions you can choose many options for the answers, these can include;
- Short answer
- Paragraph
- Multiple choice
- Checkbox
- Drop down
Settings - when clicking on the cog in the top right-hand corner. This can allow you to change preferences such as;
- Limit to completing the form once
- Restricted to users in the domain/network
- Making it a general form or creating a quiz where you can score the test.
Sharing/sending - Forms can be shared through
- Link
- Embedded
Response data - you can also collect data from the responses and create;
- Graphs
- Or select response destination - send them to the same or different spreadsheets.
We also explored My Maps. A tool that allows us to create our own maps for different purposes. We were able to import new layers where we could mark the map, create distances, import spreadsheet information (e.g. holiday destinations) etc.
This could be a great tool for students to use for reading activities, exploring maths (geometry) and many other things.
The thing that I found most valuable and useful for the day was Google Spreadsheets. For me, I use spreadsheets already for my teaching and assessment but learnt things that would assist me.
Things you can use are
- formatting data
- mean, sum and average
- filtering data
- autofill boxes
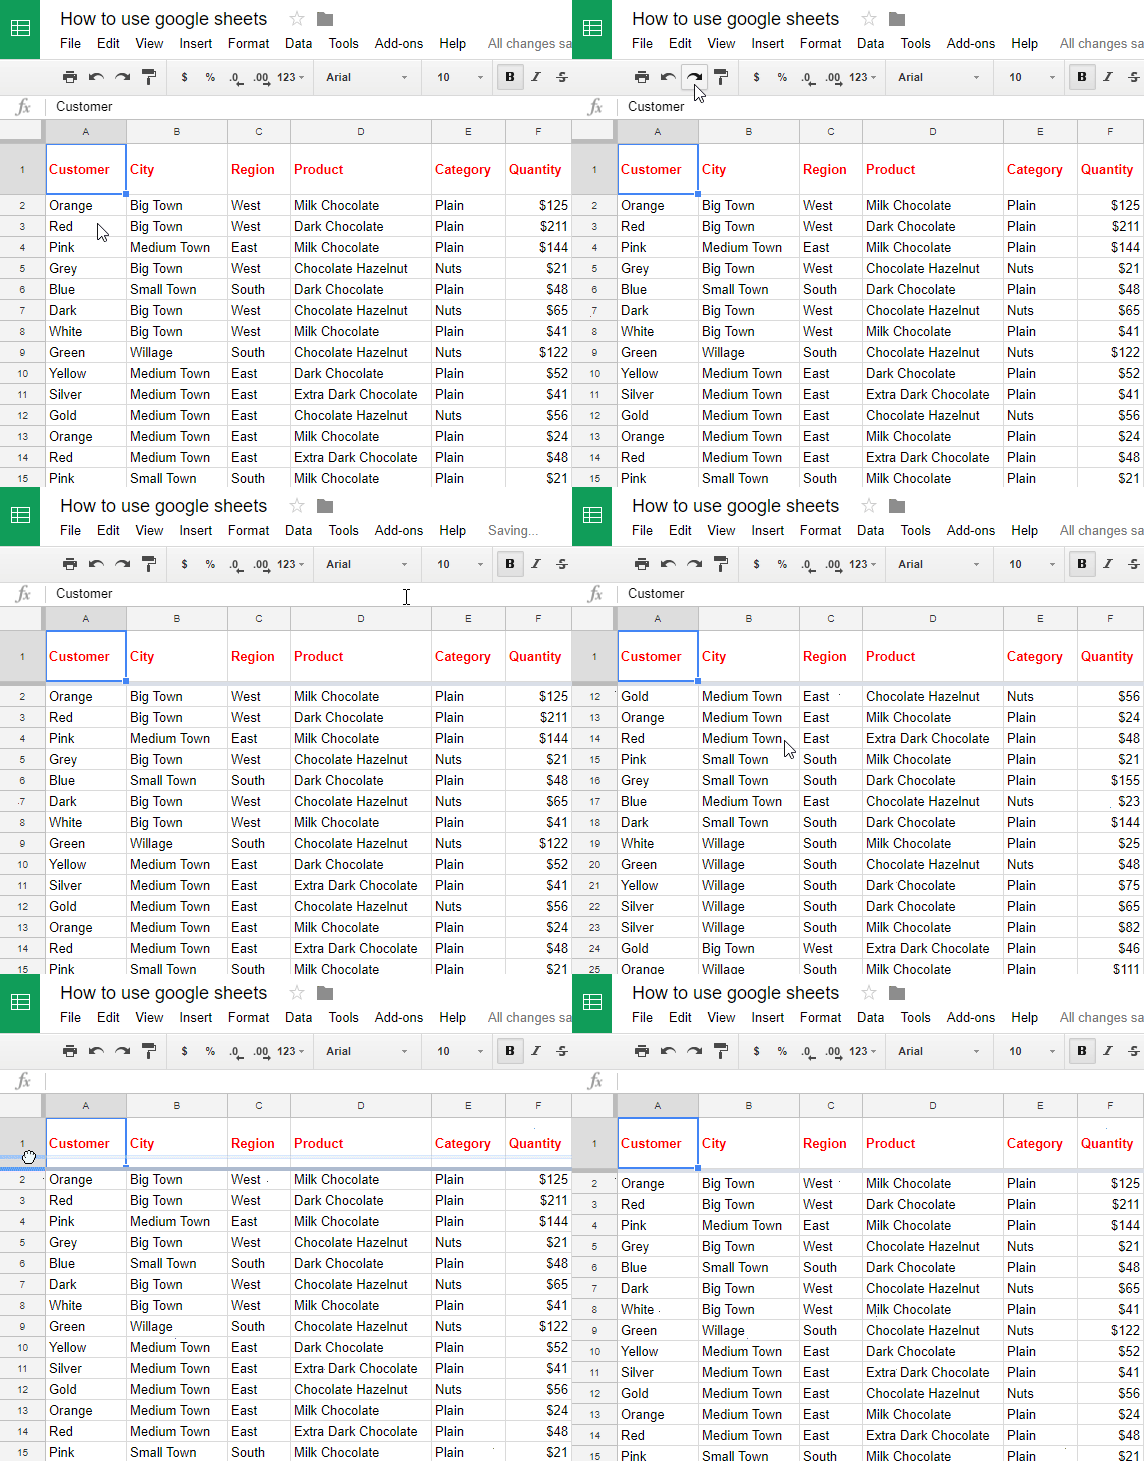
Using the freeze tool allows us to freeze columns or rows from moving. You do this by moving the grey line in the top left-hand corner in the box. In doing this you are locking your heading in place as you scroll through the data.
We also explored using conditional formatting. This is under 'format'. When using this it can allow you to colour code your boxes when entering data.
Here is an example of my assessment and conditional formatting in place.
We then got to explore spreadsheets and create charts. We chose a student's blog and showed their yearly posting using charts on the Spreadsheet. This would be an awesome way for us to teach maths (statistics) using their own data.
Here is an example of my chart.


No comments:
Post a Comment
To support my learning I ask you to comment as follows:
1. Something positive - Begin with a greeting. Talk about something you like about what I have shared.
2. Thoughtful - A comment that will mean something to me to let me know you read/watched or listened to what I had to say. - use any language.
3. Something helpful - Give me some ideas for next time or ask me a question.
Encourage me to make another post